AI is evolving at the blink of an eye
Edit me
sketch
Video short-form production
| Content | Technology Stacks |
|---|---|
| Short-form video production with generative AI tools | Generative AI, Video Editing Software, Transformers (OpenAI GPT, Google BERT), Hugging Face |
| Changes in content consumption patterns | Social Media Platforms (Facebook, Instagram, TikTok) |
| Production speed and efficiency | Generative AI, Video Editing Software, Transformers (OpenAI GPT, Google BERT), Hugging Face |
| Personalization and customized content | Generative AI, Transformers (OpenAI GPT, Google BERT), Hugging Face, Custom Datasets |
| Technological advancements | Social Media Platforms (Facebook, Instagram, TikTok), Generative AI, Voice Cloning Tools, Background Tools (Movio, Pexels), Video Editing Software (Runway Gen2) |
× myThoughts: With the combination of advanced AI capabilities from OpenAI and the expansive reach of Google’s video platforms, Gen X could serve as a catalyst for further innovation and adoption in video content creation!! Sora Luminiere GenX
resource links
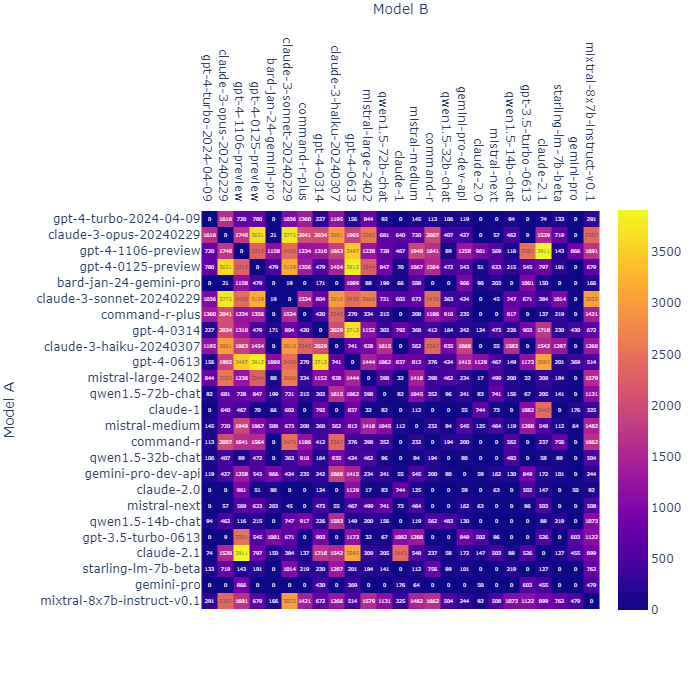
model performance eval
leaderboard leaderboardDataset
 |
 |
otherBoard with a github demo
modelPerformanceEval
 benchmarkLLM

PhoenixTest monitoringGenerativeApplication HF-gptBase


Fastest LLM
AI docent Test Items
ai-docent use onofftony or uconcreative
https://llm-speedtest.colearn.cloud/?source=post_page—–ba3cca28f246——————————– wiki
https://wiki.loadium.com/test-settings/what-is-tps
{
"message_is_conversation_continuation": "True", // <-
"number_of_messages_in_conversation_so_far": "1", // <-
"user_sentiment": "Aggravated", // <-
"query_type": "Hardware Issue", // <-
"response_tone": "Validating and solution-oriented", // <-
"response_requirements": "Propose options for repair or replacement.", // <-
"user_requesting_to_talk_to_human": "False", // <-
"enough_information_in_context": "True" // <-
"response": "..." // X -- benefits from GPT-4
}
Round trip time: 0.52s

Model: llama3-8b-8192

Input   Output   Total
Speed (T/s)   2267   875   1929
Tokens   170   21   191
Inference Time (s)   0.07   0.02   0.
text-davinci-003
1. **Perplexity:** On a test dataset of 1,000 samples, the model achieved a perplexity score of 18.5, which indicates that it is able to predict the next word in a sentence with a reasonable level of accuracy.
2. **BLEU score:** On a translation task, the model achieved a BLEU score of 32.8, which indicates that its translations are relatively close to human-generated translations.
3. **ROUGE score:** On a summarization task, the model achieved a ROUGE-1 score of 48.5, which indicates that its summaries contain a high proportion of the important information from the original text.
4. **Accuracy:** On a binary text classification task (spam detection), the model achieved an accuracy of 96.3%, which indicates that it is highly accurate at detecting spam messages.
5. **F1 score:** On a multi-class text classification task (sentiment analysis), the model achieved an F1 score of 85.4%, which indicates that it is able to accurately classify the sentiment of a text.
6. **Training time:** The model was trained for 24 hours on a cluster of 100 GPUs.
7. **Inference time:** The model takes approximately 0.5 seconds to generate a response to a given prompt on a single GPU.
8. **Model size:** The model has 175 billion parameters and takes up approximately 100GB of disk space.
9. **Efficiency:** The model performs approximately 2 trillion floating point operations per second (teraflops) on a single GPU.
10. **Generalization:** On a held-out test dataset, the model achieved a BLEU score of 29.6, which indicates that it generalizes well to new data.
1. **Perplexity:** A measurement of how well a language model predicts a sample. A lower perplexity score indicates that the model is better at predicting the sample.
2. **BLEU score:** A measurement of how well a machine-generated translation or summarization matches a human-generated reference. A higher BLEU score indicates that the model's output is more similar to the human-generated reference.
3. **ROUGE score:** A measurement of how well a machine-generated summary captures the important information in a longer text. A higher ROUGE score indicates that the model's summary is more similar to the human-generated reference.
4. **Accuracy:** A measurement of how often a model's predictions are correct. This metric is often used for classification tasks, such as sentiment analysis or named entity recognition.
5. **F1 score:** A measurement of the precision and recall of a model's predictions. The F1 score is the harmonic mean of precision and recall, and is often used for imbalanced datasets.
6. **Training time:** The amount of time it takes to train a language model. This metric is often used to measure the efficiency and scalability of a language model.
7. **Inference time:** The amount of time it takes to generate predictions using a trained language model. This metric is often used to measure the real-time performance and responsiveness of a language model.
8. **Model size:** The number of parameters or the size of the model in terms of memory or disk space. This metric is often used to measure the resource requirements and portability of a language model.
9. **Efficiency:** The ratio of the number of operations performed to the amount of computation required. This metric is often used to measure the computational efficiency and resource utilization of a language model.
10. **Generalization:** The ability of a language model to perform well on new, unseen data. This metric is often used to measure the robustness and adaptability of a language model.
Click to open
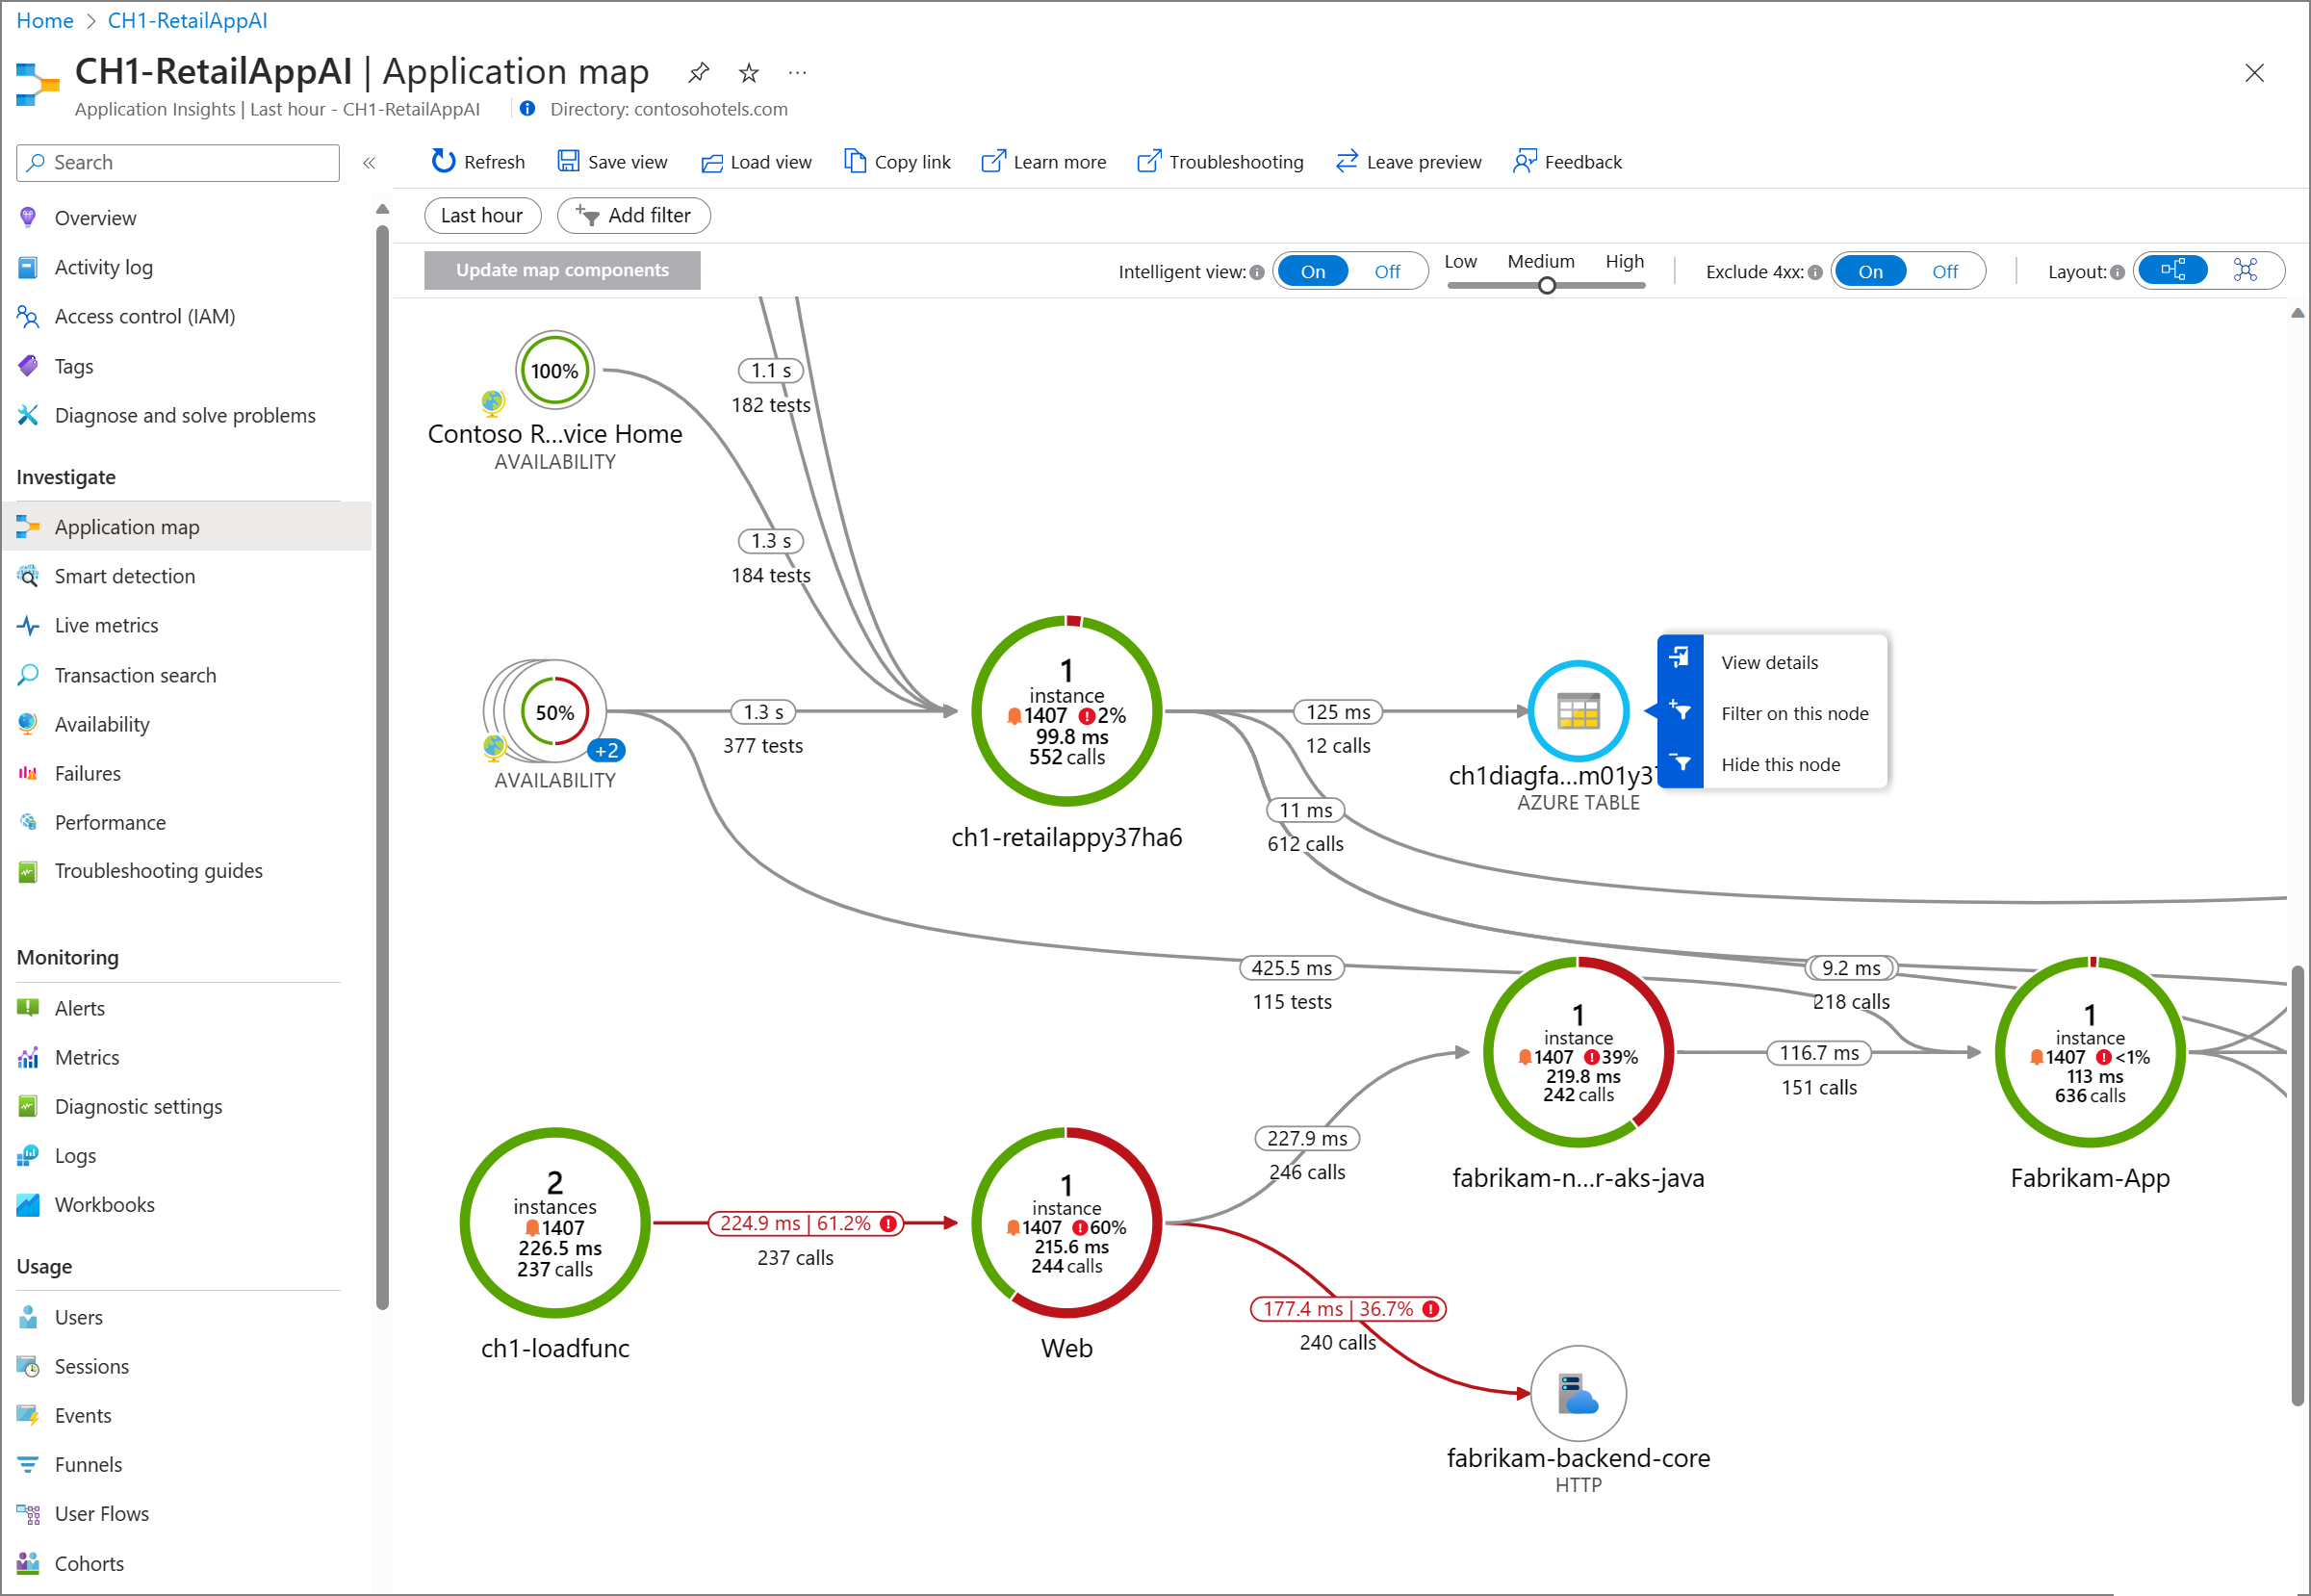
- Response time: The time it takes for a system to respond to a request. This metric is often used to measure the speed and performance of web applications and APIs.
- Throughput: The number of requests a system can handle in a given period of time. This metric is often used to measure the scalability and capacity of a system.
- Error rate: The percentage of requests that result in an error. This metric is often used to measure the reliability and availability of a system.
- Resource utilization: The amount of system resources (e.g., CPU, memory, network bandwidth) that are being used by a system. This metric is often used to measure the efficiency and cost-effectiveness of a system.
- Concurrency: The number of concurrent requests or users that a system can handle without experiencing degradation in performance. This metric is often used to measure the scalability and responsiveness of a system.
- Latency: The time it takes for a request to travel from the client to the server and back. This metric is often used to measure the network performance and responsiveness of a system.
- Failover time: The time it takes for a system to switch over to a backup or standby system in the event of a failure. This metric is often used to measure the availability and redundancy of a system.
- Recovery time: The time it takes for a system to recover from a failure or outage. This metric is often used to measure the resilience and disaster recovery capabilities of a system.
- Mean time between failures (MTBF): The average time between system failures. This metric is often used to measure the reliability and maintainability of a system.
- Service level agreement (SLA) compliance: The percentage of time that a system is meeting its agreed-upon service level agreements (SLAs) with customers or users. This metric is often used to measure the effectiveness and accountability of a system.
These are just a few examples of metrics that can be used to benchmark performance. The specific metrics that are most relevant will depend on the type of system being measured and the goals of the benchmarking exercise.